

You’ve seen the posts. The 4 AM alarm clock selfie. The boast about a 100-hour work week. The screenshot of a revenue dashboard with a suspiciously perfect, hockey-stick growth line. This is the performance theater of modern entrepreneurship, a carefully curated highlight reel designed to signal "grind" rather than demonstrate genuine progress. In early 2026, the backlash against this "hustle porn" has reached a fever pitch, with founders and investors alike calling out the toxic, unsustainable narrative it promotes.
The problem isn't the hard work—building something meaningful is hard. The problem is that these public displays have become the wrong scoreboard. They measure performance for an audience, not health for a business. While you're busy counting hours logged or social media engagement, you might be missing the silent, critical metrics that actually determine whether your startup will survive the next quarter or quietly bleed out.
This shift in discourse, highlighted in recent pieces from TechCrunch and Forbes on "the quiet quitting of founders," creates a perfect opportunity. It's time to move beyond the vanity metrics that fake entrepreneurs, or "larpers," use as a smokescreen. Let's dissect the absurdity of their performance KPIs and replace them with a practical, slightly boring guide to the numbers that truly matter for sustainable growth and, crucially, your own well-being.
What Are Vanity Metrics and Hustle Porn?
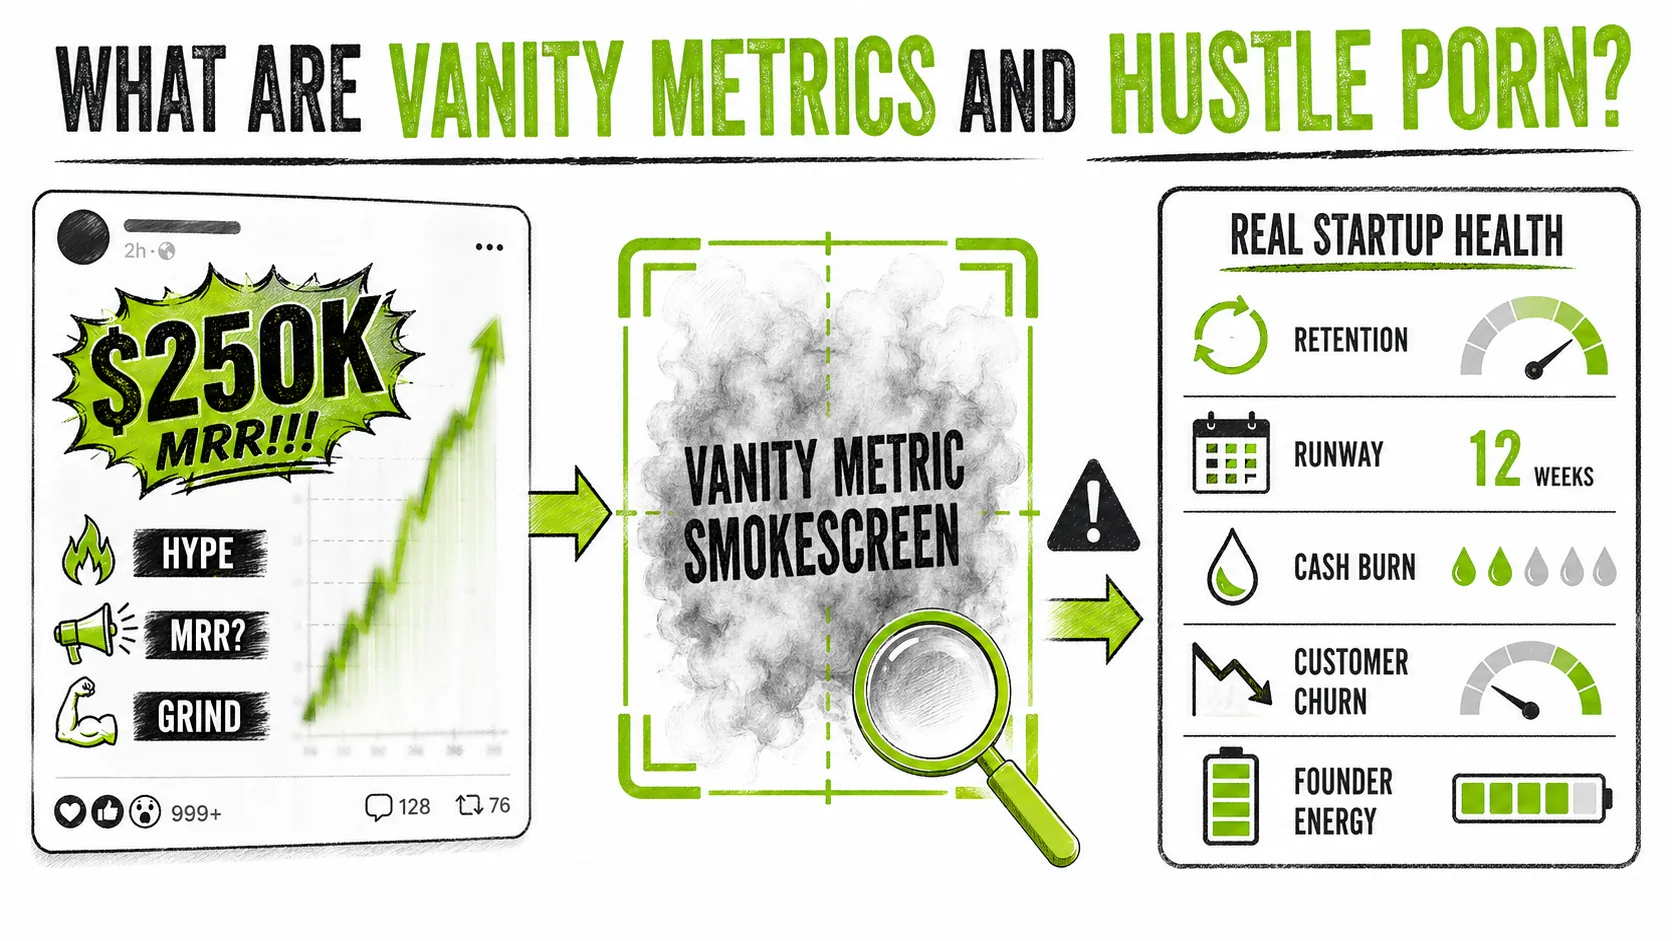
Vanity metrics are data points that look impressive on the surface but offer zero insight into your business's actual health or trajectory. They are the primary tools in the "hustle porn" toolkit, used to create an illusion of success rather than to inform strategic decisions. Hustle porn itself is the performative glorification of overwork, burnout, and superficial milestones, often shared on social media to cultivate a specific image of relentless dedication.
The core issue is misalignment. Vanity metrics are optimized for external validation (investors, peers, social media followers), while actionable metrics are designed for internal learning and course correction. A 2025 report by the Startup Genome project found that founders who focused on vanity metrics like "total registered users" were 70% more likely to scale prematurely and fail, compared to those tracking cohort-based retention and revenue quality.
| Vanity Metric (The Illusion) | Actionable Metric (The Reality) |
|---|---|
| Total Downloads / Sign-ups | Activation Rate & Week 1 Retention |
| Social Media Followers / Likes | Lead-to-Customer Conversion Rate |
| "Hours Worked" / "Lines of Code" | Output Quality & Project Velocity |
| Gross Revenue / Top-Line Growth | Net Profit, Burn Rate & Runway |
| Press Mentions / Speaking Gigs | Paying Customer Acquisition Cost (CAC) |
Why Do Founders Fall for Vanity Metrics?
Founders fall for vanity metrics because they provide immediate, dopamine-fueled validation in an otherwise uncertain and grueling journey. Getting 1,000 sign-ups from a Product Hunt launch feels like success, even if 990 of those users never log in again. A venture capitalist I spoke with in late 2025 put it bluntly: "We see decks all the time boasting 'millions of users.' My first question is always, 'How many would notice if you turned off the servers tomorrow?' The silence is telling."
The social media ecosystem actively rewards this behavior. Algorithms favor engagement, and nothing drives likes and comments like a dramatic "rise and grind" narrative or a screenshot showing explosive growth. This creates a perverse incentive structure where looking successful can be more immediately rewarding than the slow, hard work of being successful. It's a trap that ensnares even well-intentioned founders, warping their perception of progress.
How Can You Spot a 'Larper' by Their Metrics?
You can spot an entrepreneur "larper" by their obsessive focus on metrics that are easily manipulated or lack business context. They will consistently highlight inputs (effort) over outputs (results) and top-line numbers over bottom-line sustainability. For example, they'll talk about "building in public" by showing their GitHub commit streak, but never disclose their monthly recurring revenue (MRR) or churn rate.
Another red flag is the absence of time-based cohorts. A real operator discusses retention in cohorts (e.g., "Users who signed up in January have a 40% 90-day retention rate"). A larper will only ever discuss "total users," a number that only goes up and hides all attrition. They also love ambiguous, unverifiable metrics. Phrases like "millions in pipeline" or "explosive growth" without defined parameters or credible sources are hallmarks of the performance. For a deeper dive into this, our guide on spotting fake revenue screenshots breaks down the visual tells and data inconsistencies to watch for.
What's the Real Cost of Tracking the Wrong Data?
The real cost of tracking vanity metrics is strategic blindness and eventual failure. You make poor decisions with good-sounding data. You might pour more money into a marketing channel that drives sign-ups but not activated customers, burning cash to grow a hollow user base. A seminal 2019 study in the Harvard Business Review analyzed 100+ failed startups and found that "metric myopia"—focusing on a single, often vanity, metric—was a primary contributor in over 60% of cases.
Beyond the business, the human cost is profound. Chasing "hours worked" as a KPI directly leads to burnout, degraded decision-making, and strained personal relationships. You're optimizing for exhaustion, not effectiveness. The founder becomes part of the performance, sacrificing their health on the altar of perceived productivity. This isn't sustainable growth; it's a controlled demolition of your well-being disguised as ambition.
Why Your Startup's Survival Depends on Ditching Hustle KPIs
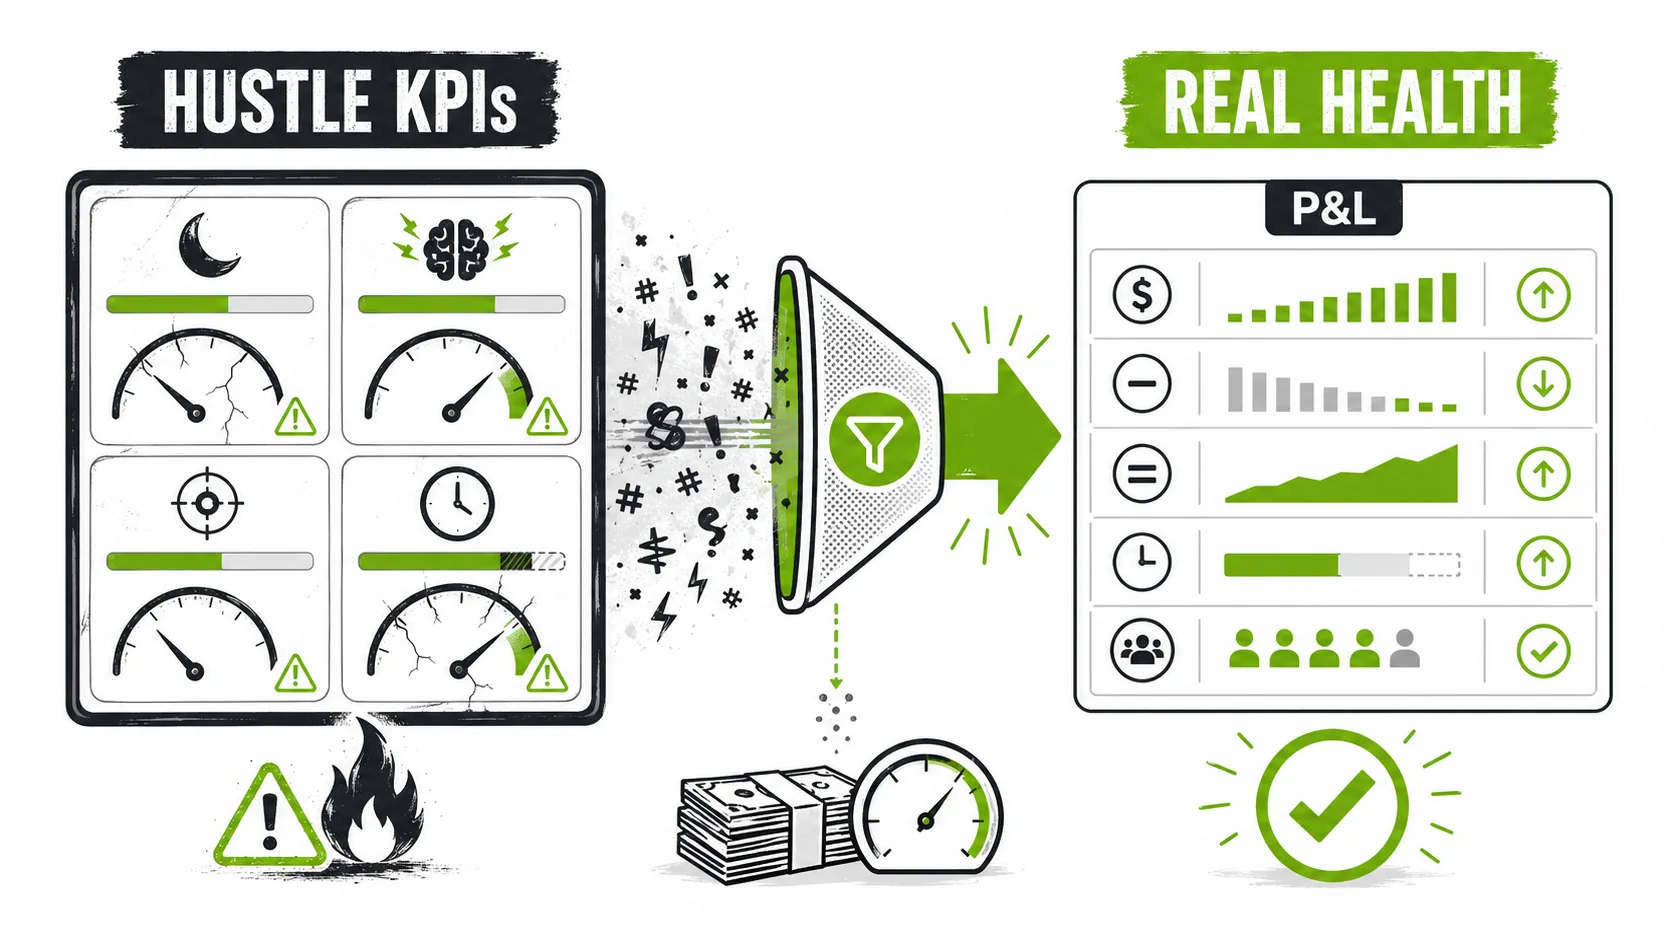
Your startup's survival depends on ditching hustle KPIs because they are lagging indicators of collapse, not leading indicators of health. Measuring hours worked tells you nothing about the quality of output, just as counting social media followers says nothing about conversion to revenue. By the time the vanity metrics plateau or the founder burns out, the underlying business issues are often terminal.
The market is waking up to this. In March 2026, a survey by First Round Capital of their seed-stage portfolio found that 73% of founders now explicitly track at least one "founder health metric" (like sleep, scheduled downtime, or net promoter score from their immediate team). This isn't touchy-feely stuff; it's risk management. A depleted founder makes catastrophic errors. The same survey noted that teams with healthier founder metrics had 30% lower employee turnover and were 25% more likely to hit product milestones on time.
Is 'Always On' Actually Killing Your Productivity?
The 'always on' mentality is almost certainly killing your productivity through cognitive fatigue and context-switching penalties. Neuroscientific research, including a 2024 meta-analysis published in Nature Human Behaviour, confirms that the brain's prefrontal cortex—responsible for complex decision-making and focus—depletes its resources with sustained use. Without deliberate rest, the quality of your decisions deteriorates. You're not working smarter; you're working harder with a blunter tool.
True productivity in startup building is about output, not activity. Writing 1,000 lines of buggy code in a 14-hour marathon session is less productive than writing 200 lines of elegant, functional code in a focused 4-hour block. The cult of busyness confuses motion for progress. When you glorify being "always on," you're implicitly valuing responsiveness over deep work, which is where actual breakthroughs and efficient problem-solving happen. It's a great way to feel busy and a terrible way to build something valuable.
What Do Investors Really Look at on Your Dashboard?
Investors really look at metrics that demonstrate sustainable, efficient growth and a clear path to profitability. They ignore the "hustle porn" entirely. In a panel I attended at SaaStr Annual 2025, a partner from Sequoia stated plainly: "We skip the 'team slide' with the smiling photos and go straight to the unit economics. Show me your LTV:CAC ratio, your gross margin, and your month-on-month net revenue retention. That's the story."
They are looking for proof of product-market fit, which is best shown through retention and engagement metrics, not top-line growth. A consistent 5% week-over-week growth in active users is far more compelling than a one-time spike of 50,000 downloads from a paid campaign. They also scrutinize burn rate and runway with extreme prejudice. A founder who brags about a long runway but has a high burn rate is seen as naive, not prudent. The investor's job is to assess real risk and potential, and vanity metrics are just noise in that signal.
How Does Misplaced Hustle Culture Mask Real Business Problems?
Misplaced hustle culture acts as a psychological bandage and a strategic smokescreen for real business problems. If the team is working 80-hour weeks, it's easy to blame a missed deadline on "needing to hustle more," rather than diagnosing a flawed process, poor specification, or misaligned priorities. The hustle becomes the scapegoat for poor management.
More dangerously, it masks fundamental issues like a weak value proposition or poor market fit. The narrative becomes, "We just need to push harder," instead of the more painful but necessary question, "Is anyone willing to pay for this?" I've seen teams grind themselves into the ground trying to force a product into a market that doesn't want it, all while celebrating their "grit" on LinkedIn. This performative suffering delays the critical pivot or shutdown decision, burning more time, money, and morale in the process. It's the business equivalent of rearranging deck chairs on the Titanic while posting inspirational quotes about perseverance.
How to Audit and Replace Your Vanity Metrics
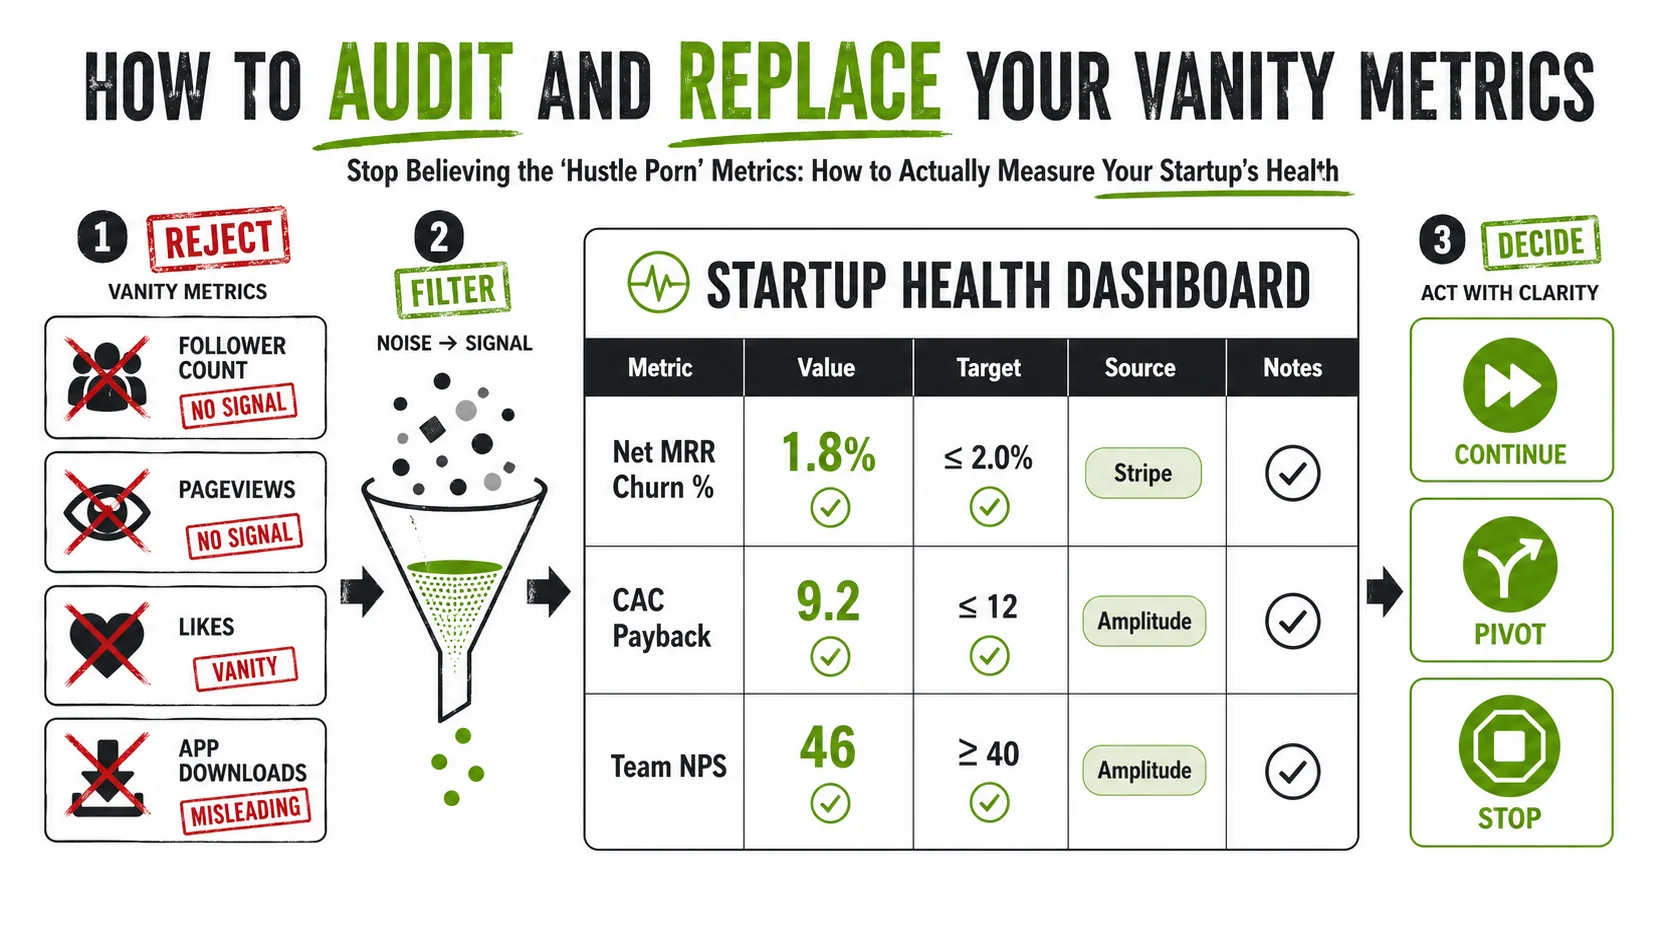
Auditing and replacing your vanity metrics is a systematic process of identifying misleading data points and swapping them for actionable ones that tie directly to business outcomes and learning. Start by listing every number you currently track. For each one, ask: "Does this metric directly help me make a better decision tomorrow?" If the answer is no, it's likely a vanity metric. The goal is to build a dashboard that surprises you with bad news early, not one that makes you feel good.
A practical framework is the "One Metric That Matters" (OMTM) approach, popularized by Lean Analytics. While you'll track more than one number, you should have a single primary metric for your current stage (e.g., Activation Rate for product-market fit, Gross Margin for efficiency). This forces focus. For example, replace "Total Pageviews" (vanity) with "Sign-up Conversion Rate from Blog" (actionable). The latter tells you if your content is working to grow the business, not just attract eyeballs.
Step 1: The Vanity Metric Purge - What to Delete Now
The vanity metric purge starts with deleting any metric that measures effort over outcome or volume over quality. Immediately stop tracking: "Hours Worked," "Total Registered Users," "Social Media Followers," "Email List Size," "Press Mentions," and "Website Traffic." These are not bad to have, but they are terrible to optimize for. They create false positives and distract from what matters.
Next, scrutinize your financials. "Gross Revenue" is a vanity metric if you're not accounting for costs. A $100,000 month sounds great until you realize it cost $120,000 to generate. Shift your primary financial focus to "Gross Profit" (Revenue - Cost of Goods Sold) and "Net Burn Rate." This purge isn't about having less data; it's about removing the noisy data that clouds your judgment. Create a "vanity metric graveyard" in your notes to remind yourself what not to celebrate.
Step 2: Identifying Your 'One Metric That Matters'
Identifying your 'One Metric That Matters' (OMTM) requires aligning a single key metric with your startup's current most critical risk or goal. For most early-stage startups, this is proving value. Therefore, a strong OMTM is often Week 1 Retention or Activation Rate (the percentage of users who hit your defined "aha moment"). If users don't return or experience core value immediately, nothing else matters. Tools like Amplitude or Mixpanel are built to track these behavioral cohorts.
As you scale, the OMTM evolves. In the growth stage, it might become Net Revenue Retention (NRR)—do your existing customers spend more over time? A rate over 100% is the holy grail of SaaS. In the efficiency stage, it could be CAC Payback Period—how many months of profit from a customer it takes to recoup the cost to acquire them. The key is that this metric is your north star for a defined period (e.g., a quarter). Every team should know it and be able to explain how their work impacts it. For more on setting foundational goals, explore our productivity hub.
Step 3: Setting Up a Simple, Truth-Telling Dashboard
Setting up a simple, truth-telling dashboard means aggregating your 5-10 key actionable metrics in one view, updated automatically. Avoid complex BI tools at first. Start with a connected Google Sheet that pulls data via APIs from your core platforms: Stripe for revenue and churn, your analytics platform (like Amplitude) for engagement, and Google Analytics 4 for marketing funnel metrics. The Stripe API documentation provides clear guides on pulling revenue and subscription data.
The dashboard should be brutally honest. It should highlight red trends before anyone has to ask. Use conditional formatting to turn cells red when, for instance, burn rate exceeds plan or activation rate drops week-over-week. Share this dashboard transparently with your core team. The psychological shift is powerful: you're moving from a culture of reporting good news to a culture of collaboratively solving problems shown by the data. The dashboard isn't a report card; it's a diagnostic tool.
Step 4: Tracking Founder Health as a Leading Business Indicator
Tracking founder health as a leading business indicator means quantifying your own capacity to prevent burnout-induced failure. This isn't soft; it's systems thinking. Start tracking three personal metrics: 1) Sleep hours (via Oura Ring or Apple Health), 2) Deep Work blocks (via a tool like RescueTime or manual calendar blocking), and 3) a weekly Personal Energy Score (1-10). A 2023 study in the Journal of Business Venturing found that founders who consistently slept less than 6 hours made 25% more strategic errors in simulated exercises.
Correlate this data with your business output. You'll likely find that weeks with higher energy scores correspond with better decision velocity and team morale. When your sleep dips below a threshold for three days straight, treat it with the same urgency as a drop in key revenue metrics. Schedule "capacity reviews" for yourself, not just performance reviews for the team. By making your health a visible, tracked metric, you legitimize its importance and create early warning signals for when you need to step back and recharge, protecting the company's most critical asset: your clear-headed judgment.
Step 5: Implementing Weekly Metric Reviews That Don't Lie
Implementing weekly metric reviews that don't lie requires a strict, data-driven ritual focused on change and causation. Every Monday morning, gather the core team for a 30-minute review of the truth-telling dashboard. The format is simple: "What changed significantly (up or down) last week? What did we do that might have caused it? What is our one experiment for this week to learn or improve?"
Ban vague language. Instead of "Traffic was up," require "Organic blog traffic increased 15% week-over-week, driven by our post on X which ranks #3 on Google." Instead of "Churn is bad," say "Churn increased to 5.2% from 3.8%, primarily in customers from our February ad campaign, suggesting a mismatch in expectations." This discipline forces you to connect actions to outcomes and stops you from celebrating or fretting over random noise. The review output is always a concrete, testable hypothesis for the coming week, turning metrics from a report into an engine for learning.
The Boring, Beautiful Metrics That Actually Predict Success
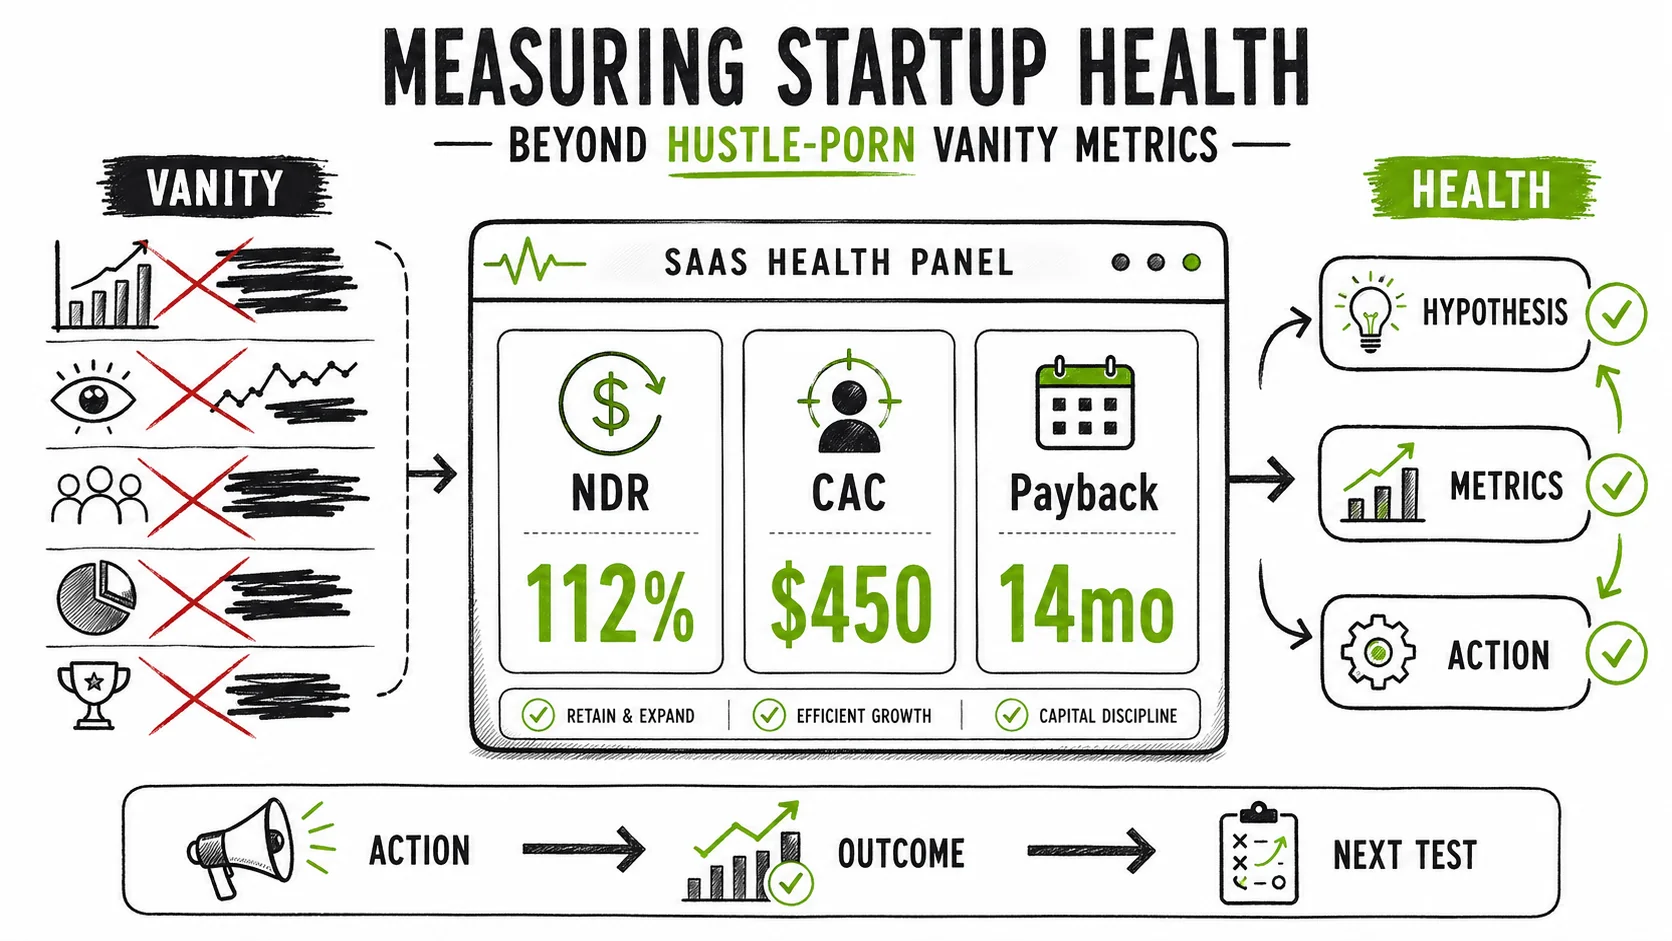
The boring, beautiful metrics that actually predict success are the unit economics and health indicators that reveal sustainable efficiency, not just top-line speed. They are often ratios or rates, not raw numbers, and they tell a story of quality over quantity. While vanity metrics scream for attention on social media, these quiet metrics work behind the scenes, determining whether your startup has a viable engine or is just burning fuel.
For Software-as-a-Service (SaaS) businesses, which dominate the tech startup landscape, a core set of these metrics has become gospel. Investors like David Skok have written extensively on frameworks that prioritize Lifetime Value (LTV) to Customer Acquisition Cost (CAC) ratio, Months to Recover CAC, and Net Revenue Retention. A 2026 benchmark report by OpenView Partners found that the top quartile of SaaS companies had an LTV:CAC ratio greater than 3:1 and a CAC payback period of under 18 months. These aren't sexy, but they are the difference between a business that scales and one that scales itself into bankruptcy.
Why is Net Revenue Retention (NRR) the King of SaaS Metrics?
Net Revenue Retention is the king of SaaS metrics because it measures your ability to grow from your existing customer base, which is the most efficient and profitable growth possible. NRR calculates the revenue from a cohort of customers at the start of a period, factoring in upgrades, cross-sells, and downgrades or churn, then expresses it as a percentage. An NRR over 100% means you're growing even if you never acquire another new customer.
This metric captures everything: customer satisfaction, product value, and upsell effectiveness. It's the ultimate test of product-market fit. A high NRR creates a powerful flywheel: revenue compounds, CAC becomes more efficient as you retain customers longer, and the business becomes predictably resilient. Companies like Slack and Zoom famously built empires on NRR figures well above 120%. If you only track one "growth" metric, make it NRR. It tells you if your core business is fundamentally healthy or if you're on a leaky treadmill, constantly running to replace lost revenue.
What Does Your Burn Rate Really Tell You About Runway?
Your burn rate tells you the brutal, non-negotiable truth about your startup's remaining lifespan at current spending levels. It's calculated as Net Burn (cash spent minus cash earned) per month. Runway is simply your current cash balance divided by your net burn rate. For example, $500,000 in the bank with a $50,000 monthly net burn equals a 10-month runway. This isn't a suggestion; it's a countdown clock.
A "good" burn rate is one that is intentional and aligns with a plan. A high burn rate is fine if you've deliberately chosen to invest aggressively in a proven growth channel with a known payback period. A low burn rate is dangerous if it's caused by an inability to spend on effective growth, leaving you in "zombie" mode. The real insight comes from tracking the trend. Is your burn rate increasing because revenue is flat and you hired more people? That's a five-alarm fire. Is it decreasing because gross margins are improving? That's progress. Your burn rate is the heartbeat of your startup's financial health—ignore it at your peril.
How Can Cohort Analysis Uncover Your True Growth Story?
Cohort analysis uncovers your true growth story by slicing your users or customers into groups based on when they started (e.g., "January Sign-ups") and tracking their behavior over time. This is the antidote to the vanity of "total users." It reveals whether your product is getting better at retaining customers or if early growth was just a marketing flash in the pan.
For instance, you might see that users who signed up after you launched a key new feature have a 30% higher 60-day retention rate than those who signed up before. That's a powerful signal of product improvement. Conversely, you might discover that customers acquired through a specific paid ad channel have a much higher churn rate, indicating poor audience targeting. Tools like Mixpanel and Amplitude are built for this kind of analysis. It moves you from asking "How many users do we have?" to the far more valuable question: "Are we getting better at creating value for the users we acquire?" This is the essence of sustainable growth.
Putting It All Together: A Sustainable Operating System
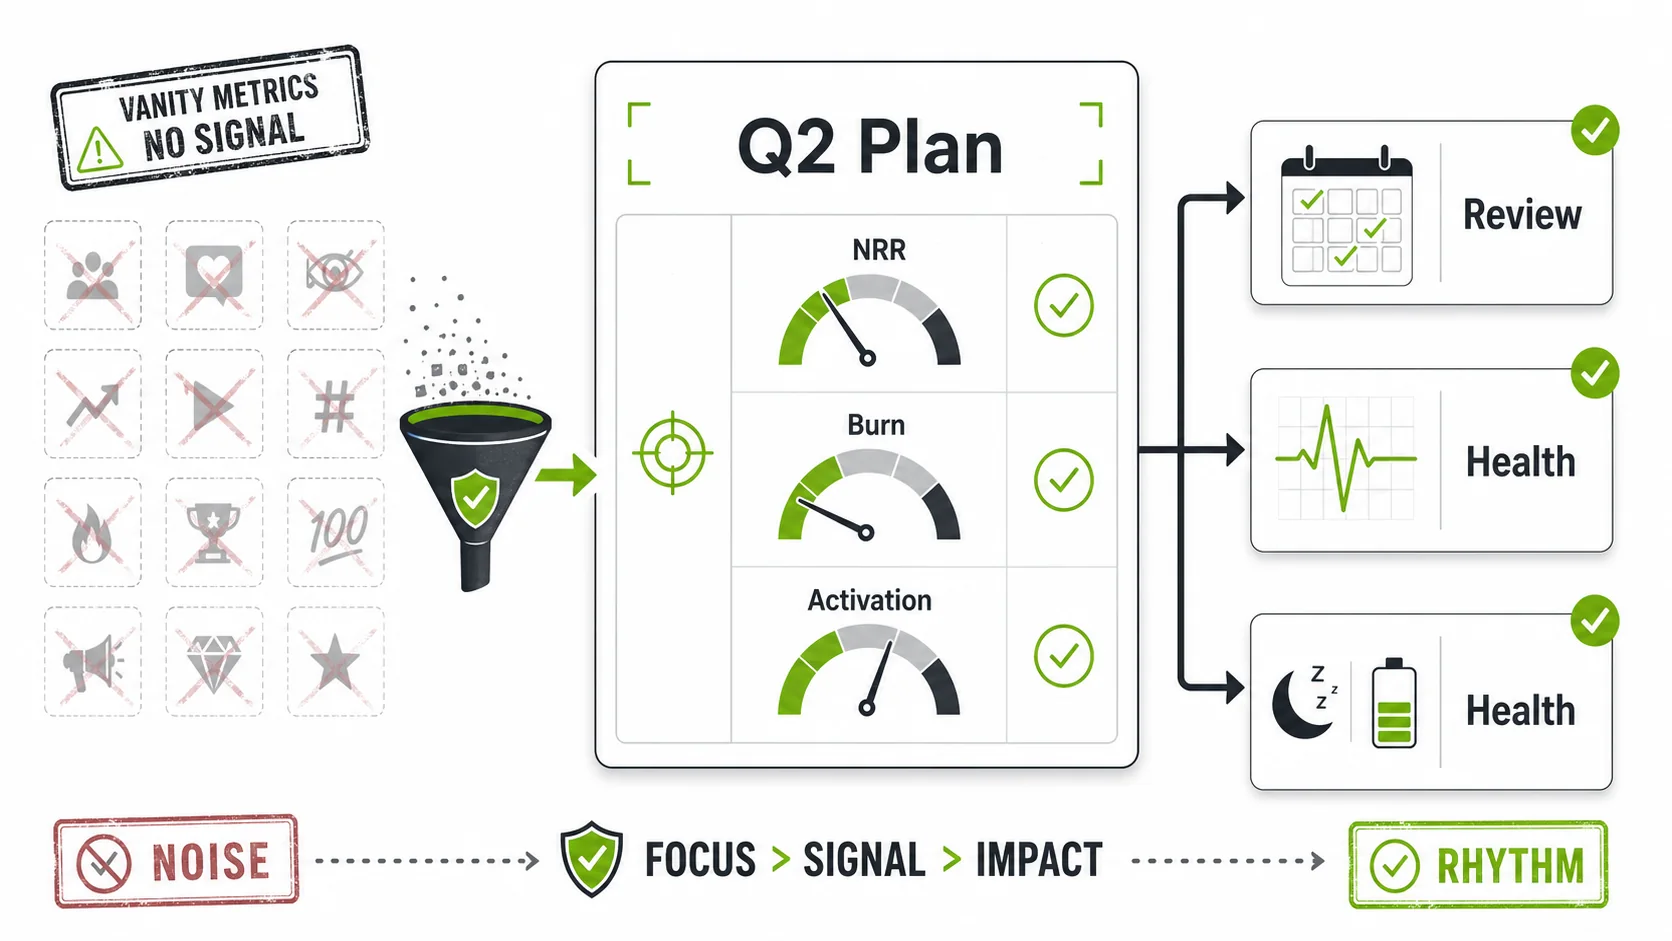
Putting it all together means building a sustainable operating system that integrates real metrics, disciplined reviews, and founder health into a single, coherent workflow. This system replaces the chaotic, reactive "hustle" mode with intentional, rhythm-based execution. The goal is to create a business that learns and adapts efficiently, without consuming its creators in the process.
This system has three interconnected gears: Measurement (the truth-telling dashboard), Rhythm (the weekly reviews and quarterly planning), and Renewal (the tracked founder health and enforced boundaries). When these gears turn together, the startup gains resilience. You spot problems when they're small, allocate resources to what's proven to work, and maintain the strategic capacity to pivot when necessary. It's the difference between driving with a detailed map and a full tank of gas versus flooring the pedal while blindfolded and hoping you don't hit a wall.
How to Communicate Real Progress to Stakeholders (Without the Hype)
Communicating real progress to stakeholders means telling a story with actionable metrics, not vanity stats. In your investor updates or board decks, lead with the metrics that matter: Net Revenue Retention, Gross Margin, Burn Rate/Runway, and your OMTM. Provide context with cohort charts showing retention trends. Explain changes: "NRR increased to 108% this quarter, driven by a 20% uptake in our new Premium add-on among customers older than 6 months."
Be brutally honest about challenges. Say, "Our CAC increased by 15% as channel X became more competitive. We're testing three alternative channels this quarter, and our hypothesis is that channel Y will reduce CAC by 20%." This demonstrates analytical rigor and control. Stakeholders, especially experienced investors, can smell hype from a mile away. They invest in teams that understand their business at a granular level. Showing you track the right things and learn from them builds more confidence than any hockey-stick graph ever could. It proves you're building a real company, not just a compelling narrative.
Building a Team Culture That Values Depth Over Theater
Building a team culture that values depth over theater requires leadership to model and reward the right behaviors. Stop celebrating "late nights" in team meetings. Instead, celebrate outcomes: "Great job shipping the onboarding flow; our activation rate is up 10%." Implement policies that protect focus, like "no-meeting Wednesdays" or core collaboration hours. Make the company's key metrics transparent to the entire team so everyone understands how their work ladders up to real outcomes.
Hire for curiosity and systems thinking, not just for the ability to grind. In interviews, ask questions about how candidates measure their own impact and learn from failure. When performance reviews come around, base them on contributions to key metrics and collaborative problem-solving, not on perceived effort or visibility. This cultural shift takes time, but it attracts and retains talent that wants to do meaningful work, not just perform it. It creates an environment where people can do their best work sustainably, which is the ultimate competitive advantage. This long-term perspective is what separates real ventures from flash-in-the-pan projects, a theme we explore in the truth behind the 5-year grind.
When to Ignore Metrics Entirely and Trust Your Gut
You should ignore metrics entirely and trust your gut during the earliest stages of ideation and during genuine existential pivots. Before you have a product or any users, there are no meaningful metrics to track. This is the time for qualitative learning: customer interviews, problem validation, and prototyping. Rushing to measure something premature leads to optimizing a solution nobody wants.
Similarly, when facing a fundamental strategic pivot—changing your target customer or core value proposition—historical metrics can be anchors to a past that's no longer relevant. Your gut, informed by all the qualitative feedback and market intuition you've absorbed, must guide the leap. The metrics will follow once you've landed on a new path. As Andy Grove famously said, "Only the paranoid survive." Sometimes, that paranoia is a gut feeling that the numbers, while still green, are measuring the wrong game. The key is to know which phase you're in: use metrics ruthlessly to execute and optimize, but use intuition and courage to set the initial direction and change course when the map no longer matches the territory.
Got Questions About Startup Metrics? We've Got Answers.
How often should I really check my key metrics?
You should check your core health dashboard daily, but only conduct a deep analytical review weekly. A daily glance at metrics like active users, daily revenue, and burn rate gives you a pulse check and can alert you to catastrophic, real-time issues (like a payment system failure). However, daily data is noisy. Meaningful trends only emerge over weeks. The weekly review ritual is where you analyze why things changed and plan experiments. Checking metrics hourly or obsessively throughout the day is a form of distraction, not management, and feeds anxiety more than it informs action.
What's the single biggest mistake founders make with metrics?
The single biggest mistake is tracking too many metrics and having no "One Metric That Matters." Founders often create massive dashboards with 50+ charts, drowning in data but starving for insight. This leads to analysis paralysis. You can't optimize for 10 things at once. The second biggest mistake is failing to connect metrics to specific actions. A metric moving up or down is just a signal. The value comes from the disciplined process of hypothesizing a cause, testing a change, and measuring the result. Without that closed loop, metrics are just a scoreboard, not a steering wheel.
Can a pre-revenue startup have meaningful metrics?
Absolutely. A pre-revenue startup's most meaningful metrics are all about validating problem-solution fit and engagement, not money. Key metrics include: Interview Conversion Rate (percentage of cold outreaches that turn into customer discovery calls), Problem Validation Score (how intensely potential users rate the pain point you're solving), Prototype Engagement (how users interact with an MVP—clicks, time spent, completion rates), and Waitlist Growth Rate (if you have one). These metrics measure progress toward finding a market, which is the only job of a pre-revenue startup.
Should I share all my business metrics with my entire team?
Yes, you should share the core actionable metrics that relate to the company's health and each team's area of impact. Transparency builds trust, accountability, and collective intelligence. When the engineering team sees how a feature release impacted activation rate, or the marketing team sees how their campaign affected CAC, they learn directly from outcomes. However, be judicious. Extremely sensitive data like individual salaries, detailed cap table figures, or specific investor communications should remain confidential. The rule of thumb: share metrics that help people do their jobs better and understand how the company is performing. Hiding the scoreboard from the players is a sure way to lose the game.
Ready to see past the performance and build something real?
Larpable - Detect or Create helps you cut through the noise of entrepreneurial theater. Learn to spot the vanity metrics and manipulation tactics of fake gurus, or understand the real toolkit for sustainable growth. Stop measuring your worth in hustle posts and start tracking your actual progress. Apprendre à Détecter
<!-- sister-projects-start -->
Other Doved Studio projects
Related tools from the same studio you might find useful:
- Ralphable: Generate structured Claude Code skills that iterate until pass/fail criteria are met.
- Doved Studio: Studio indie derrière cette app et une dizaine d'autres outils.
<!-- sister-projects-end -->